# Aplos Yun OEE Dashboards
# Master Dashboard
Take Note
Only user with Admin role is allowed to view Master Dashboard
# Machines Weekly OEE Trend
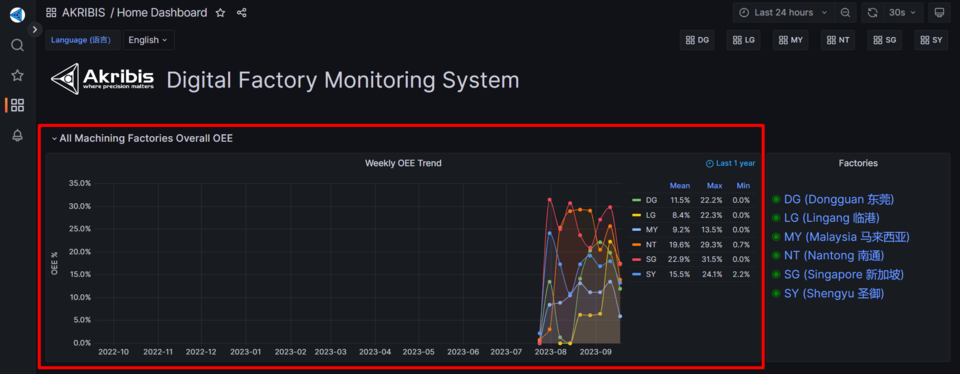
- This panel shows all machining factories overall OEE.
- The dots on the panel map represent the OEE from week to week.
# Factory List
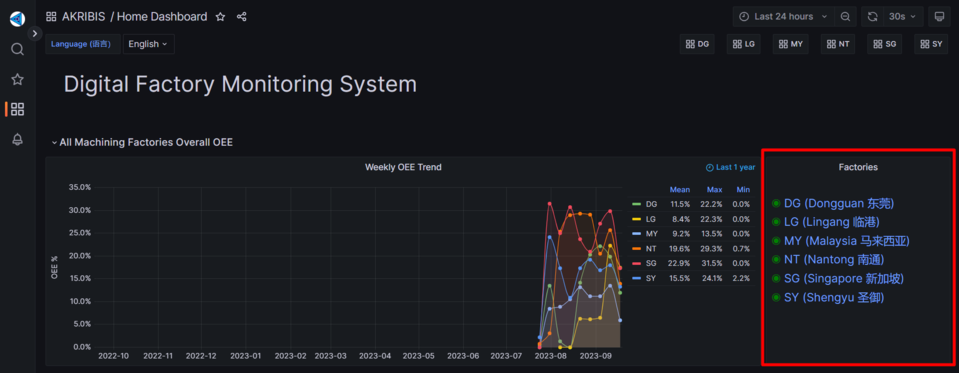
- On this panel, green dots mean the gateway unit is online.
- If it shows red dot means the unit is down. When it happens, please consult the Aplos IT people to assist you.
- If you want to add the factory unit, you may also consult the Aplos IT people to assist you.
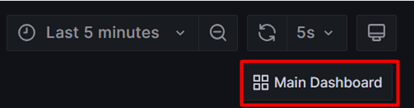
# Navigation Menu
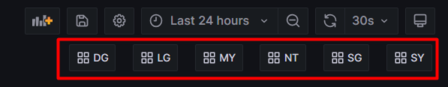
- These are the navigation buttons that will redirect to the respective unit machine dashboard.
# Main Dashboard
Take Note
The main page for a whole unit factory.
# Machine OEE Trend
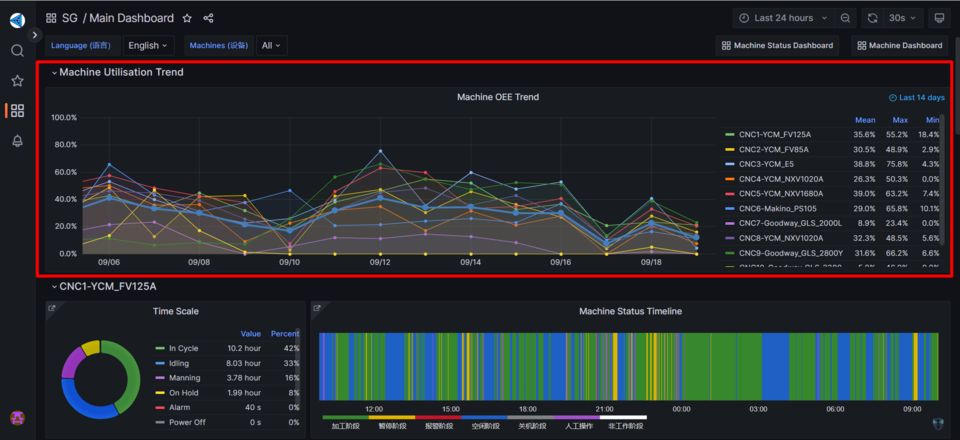
- This panel shows all machines OEE for unit main dashboard.
- It shows average, maximum, minimum OEE for the last 14 days.
# Machine Status
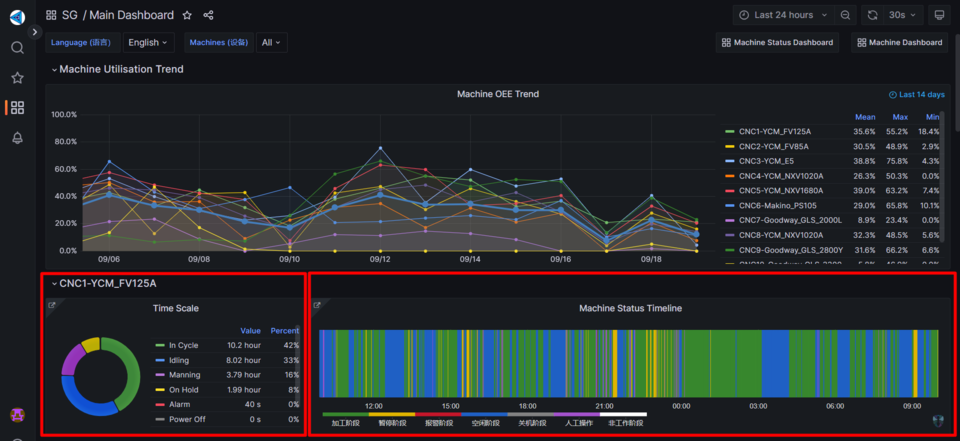
- The left panel shows the hours for the processes of Power Off, In Cycle, Idling, On Hold, Manning, Alarm, No Data of the machine.
- The right panel shows the time period of the machine’s processes to give a better outlook.
# Panel Link
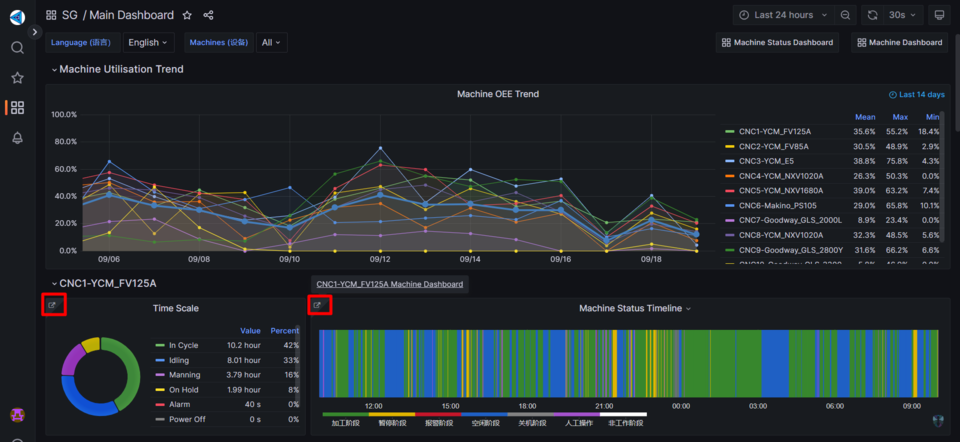
- This panel link lets you to redirect to the more in-depth details of the machine.
# Filter Machines
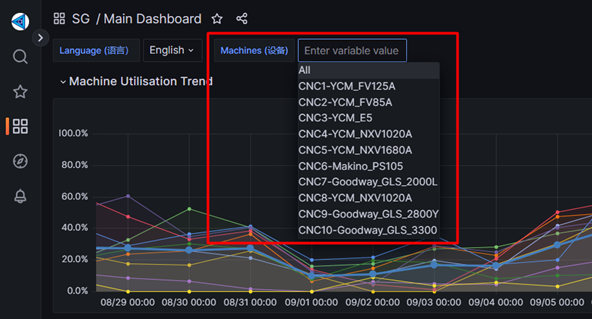
- In this dashboard, you can choose the machine you want to view from the machines drop down or it will show all the machines by default.
# Navigation Button
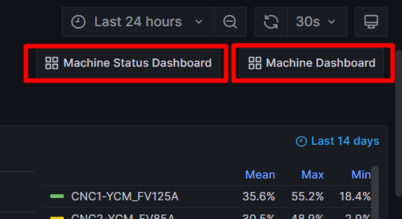
- These are the buttons to navigate Machine Status Dashboard and Machine Dashboard.
# Machine Dashboard
Take Note
All details of the machine will be displayed in Machine Dashboard.
# Machine Status Timeline
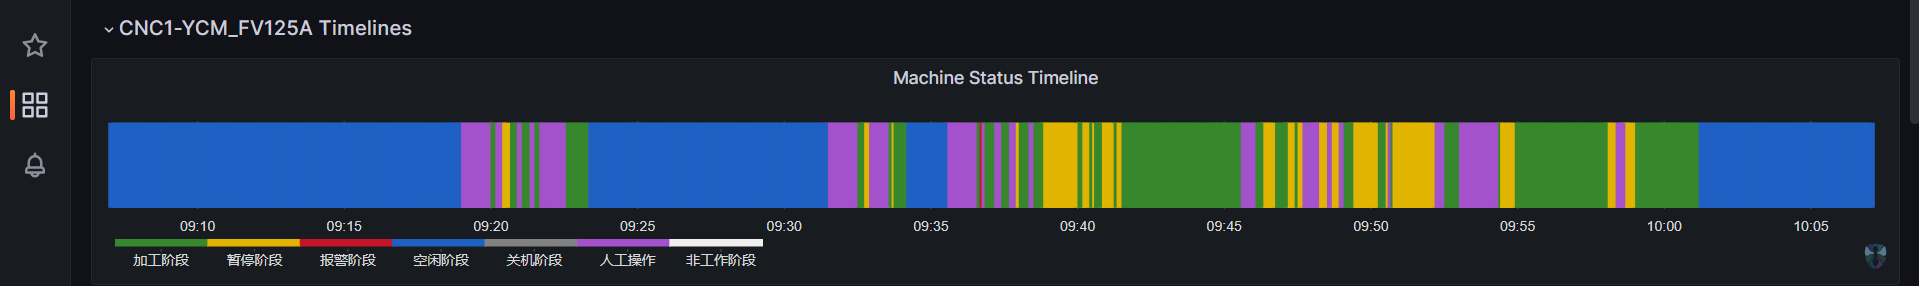
- This panel shows the time periods of the machine’s processes.
# Operation Panel Timeline
Take Note
Not all machines have operation panel
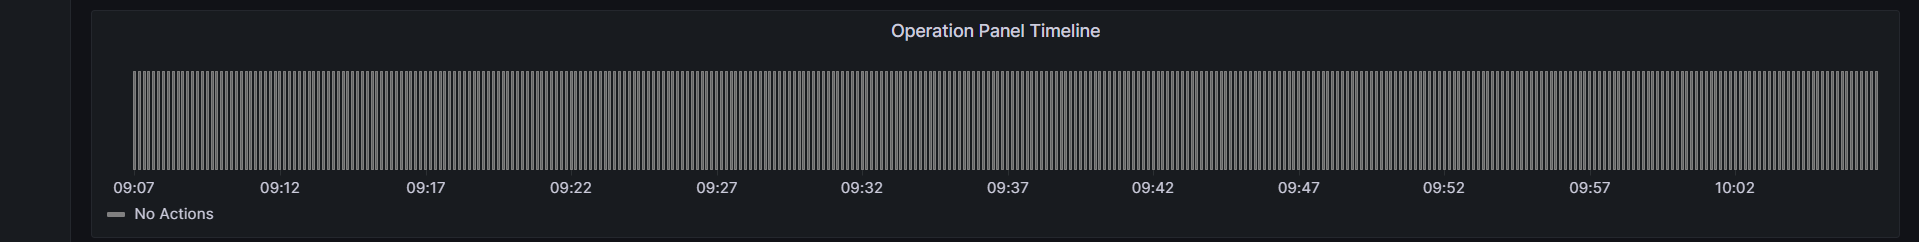
- This panel shows the menu button clicked by the operator from the operation panel.
- Example: In-Process check for tool wear, Load/Upload parts.
# Operation Panel Status Timeline
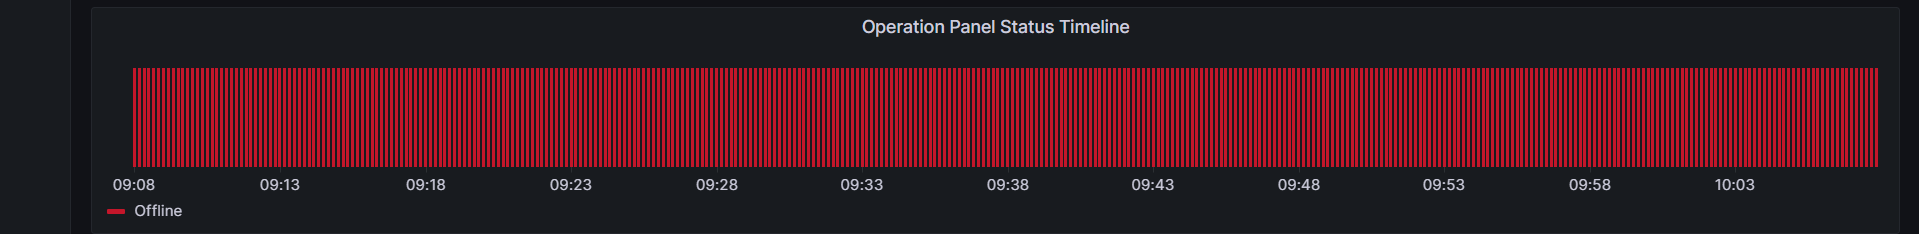
- This panels shows the availability of the operation panel which can be Disabled, Online, Offline.
# Real-Time Effectiveness
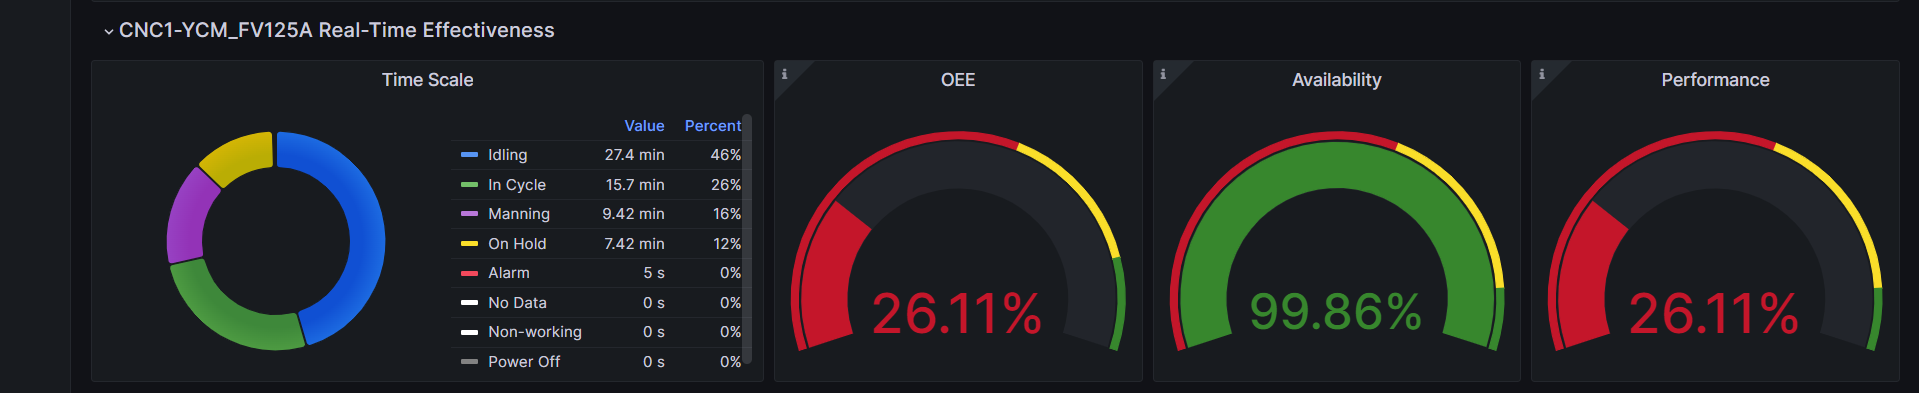
- This panel shows the time scale of the machine’s processes.
- It also shows the OEE, Availability and Performance of the machine.
# Real-Time Status
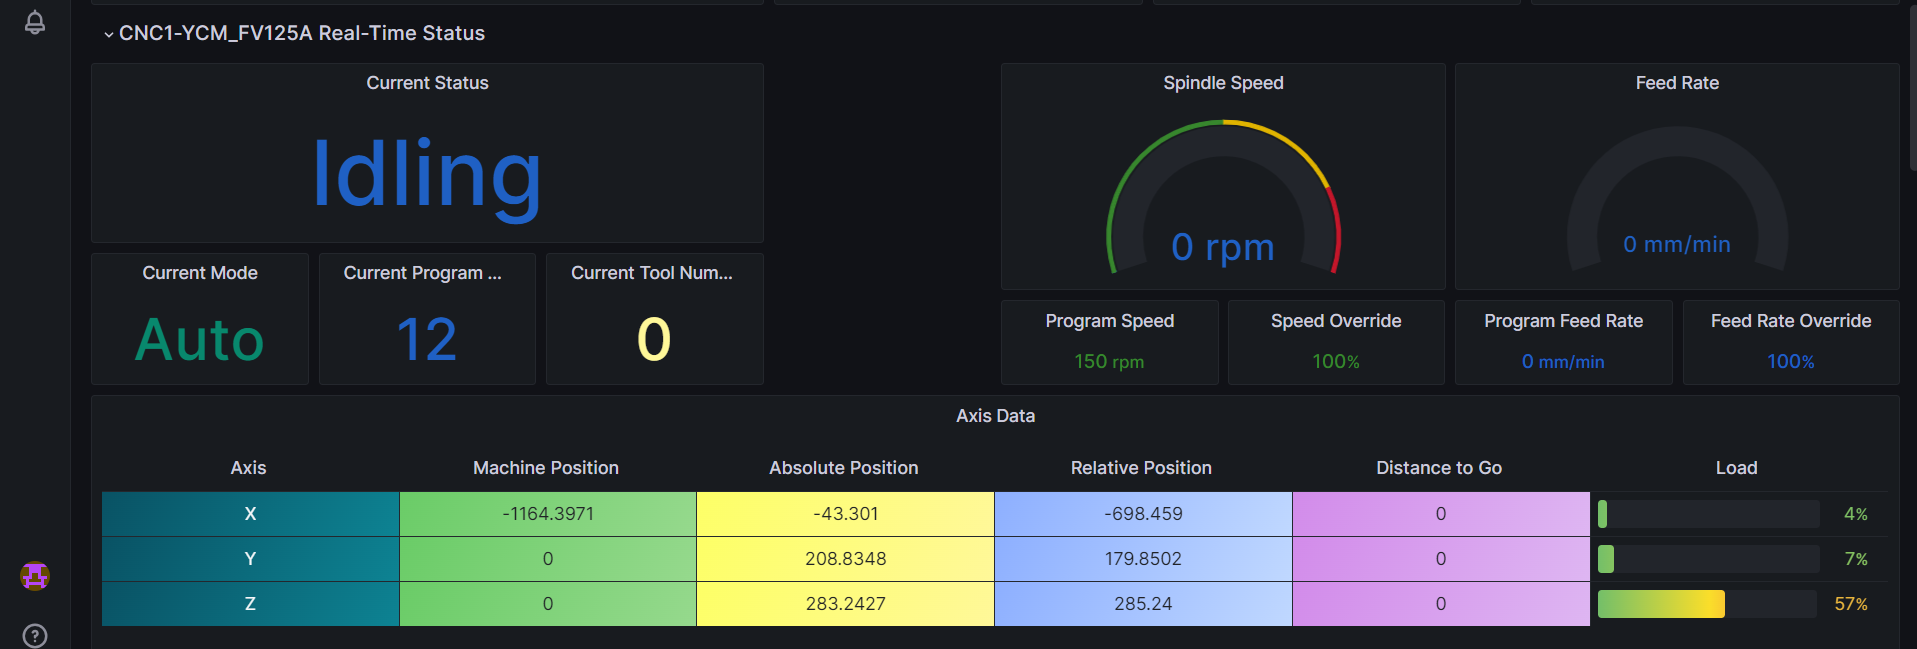
- This panel shows the Current Machine Status, Current Mode, Current Program Name and Current Tool Number.
- It also shows the Spindle Speed, Program Speed, Speed Override, Feed Rate, Program Feed Rate and Feed Rate Override data are also collected.
- Not only that, but it also shows the axis data of x-axis, y-axis, and z-axis.
# Alarm Information
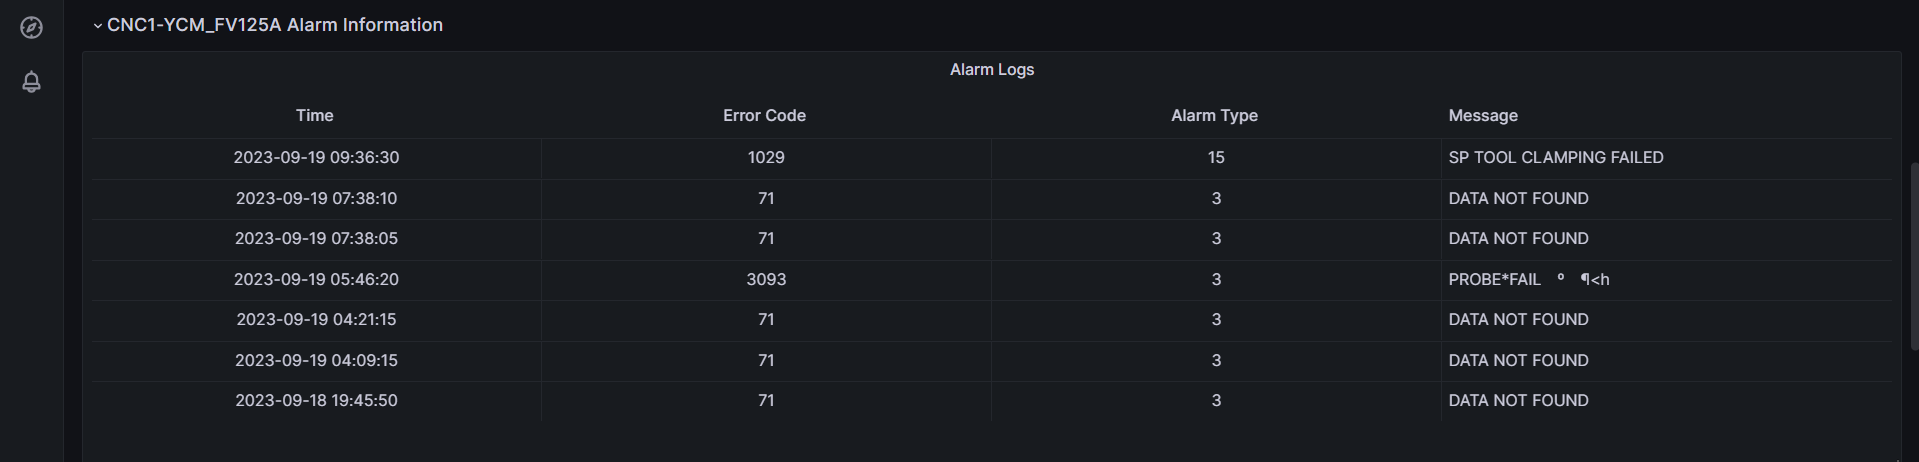
- This panels shows the Error Time Occurred, Error Code, Alarm Type and Error Message.
# Spindle Information
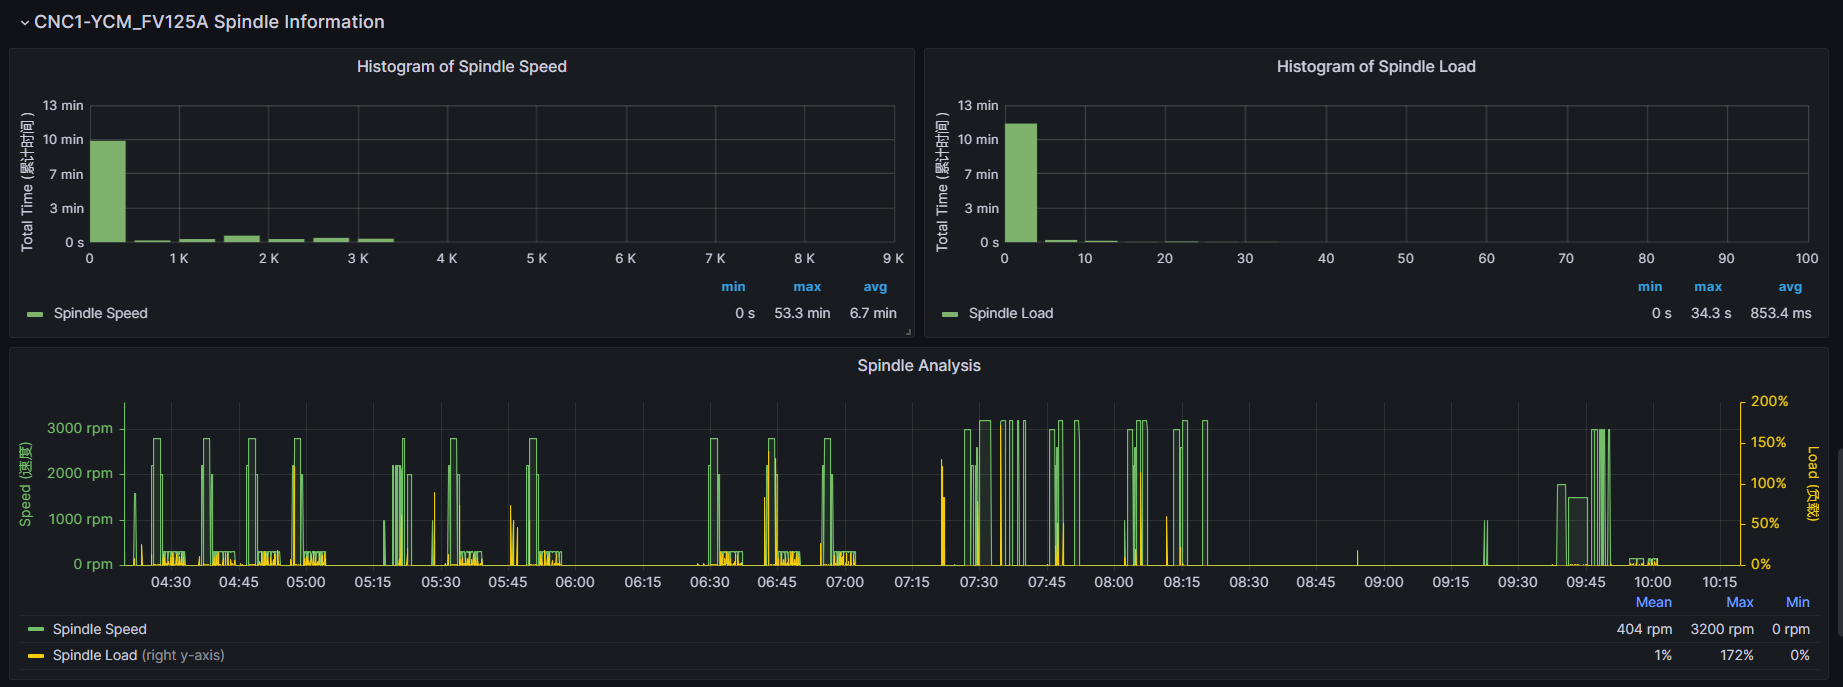
- This panel shows the Spindle Speed, Spindle Load and Spindle Analysis of the machine.
- It also shows the average, maximum and minimum for both spindle speed and spindle load.
- The spindle analysis shows the comparison between spindle speed and spindle load.
# Axis Information
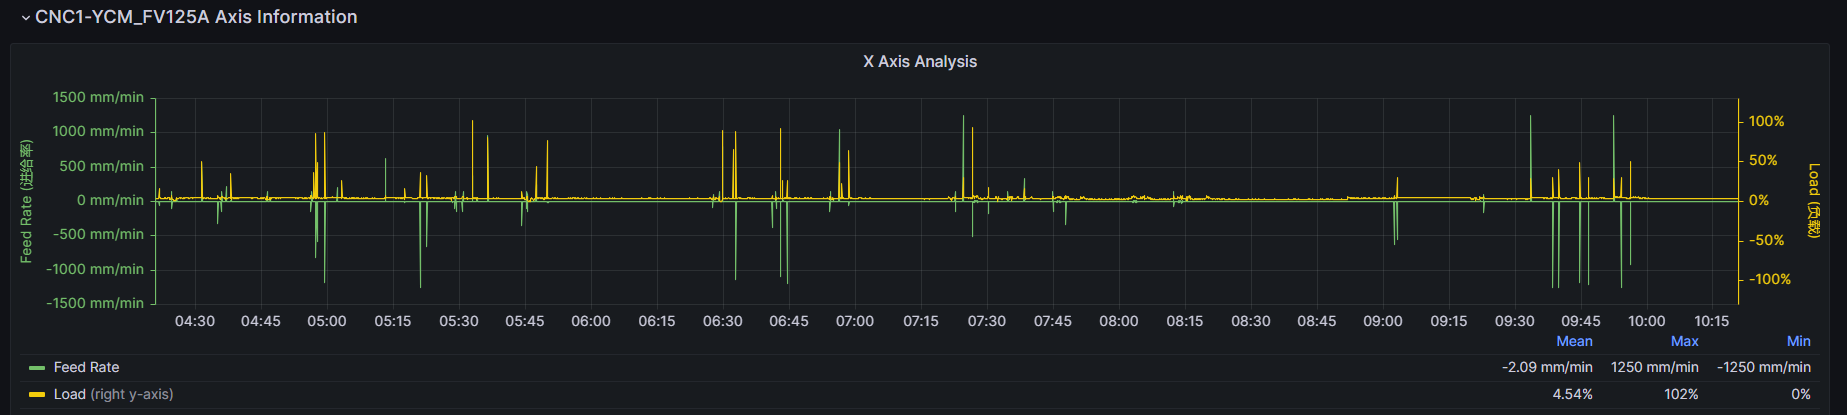
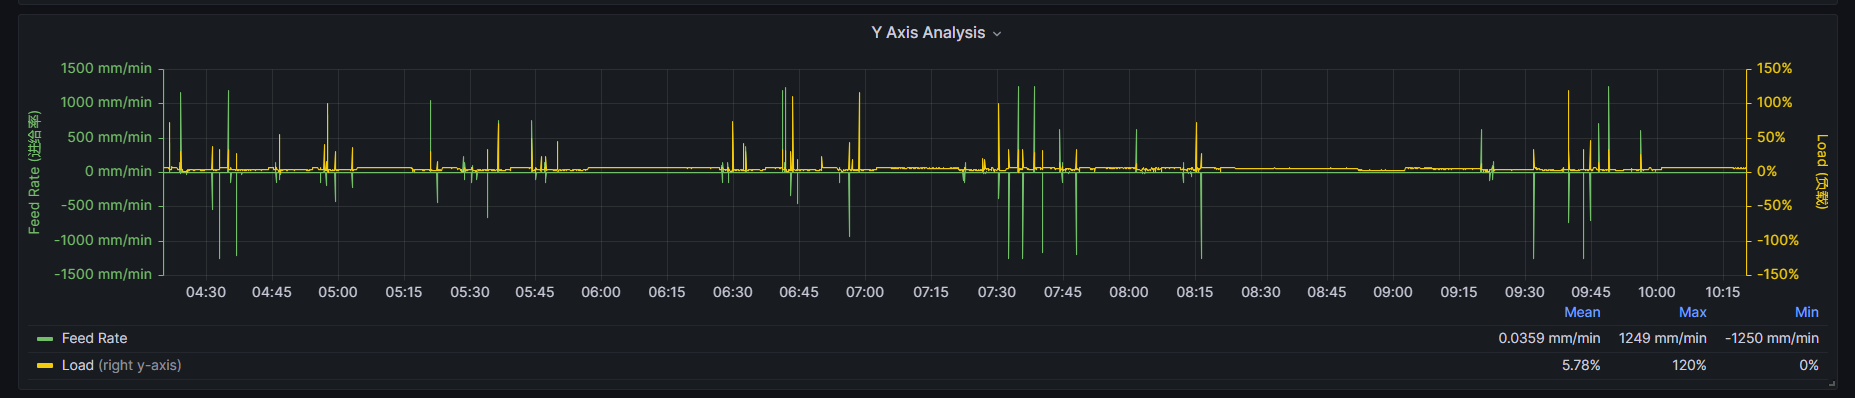
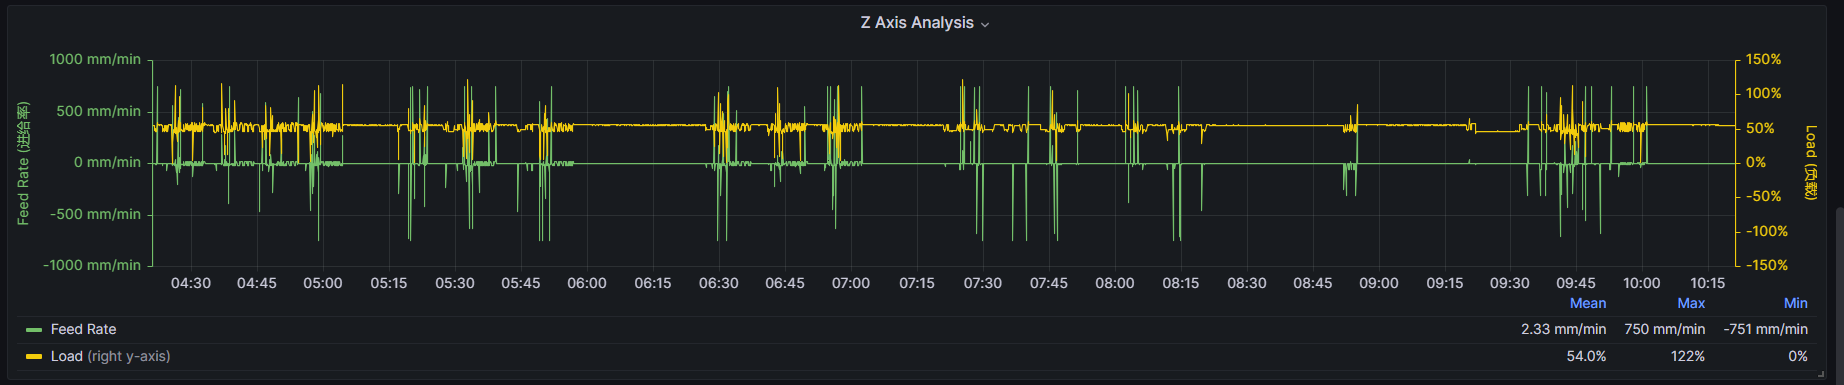
- This panel shows the x-axis, y-axis, z-axis analysis of the machine.
- It also shows average, maximum, and minimum of feed rate and load for the axes.
# Machine Status Dashboard
# Current Machine Status
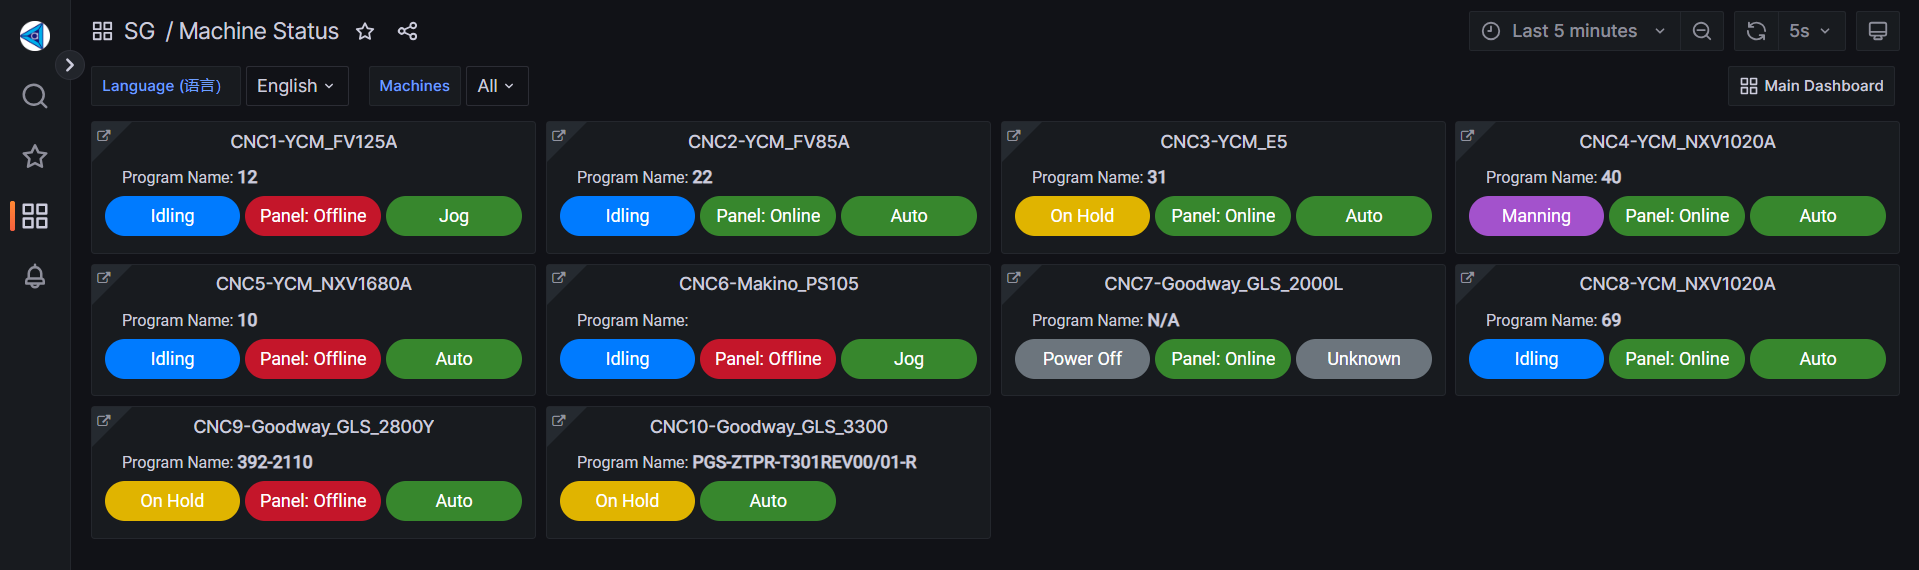
- To navigate here, you can look for Machine Status Dashboard button on top of Main Dashboard to redirect here.
- This panel shows the Current Program Name, Current Machine Status, Current Availability Panel, Current Machine Mode.
# Filter Machines
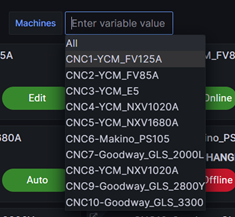
- In this dashboard, you can choose the machine you want to view from the machines drop down or it will show all the machines by default.
# Navigation Button
- This button is to navigate Main Dashboard.