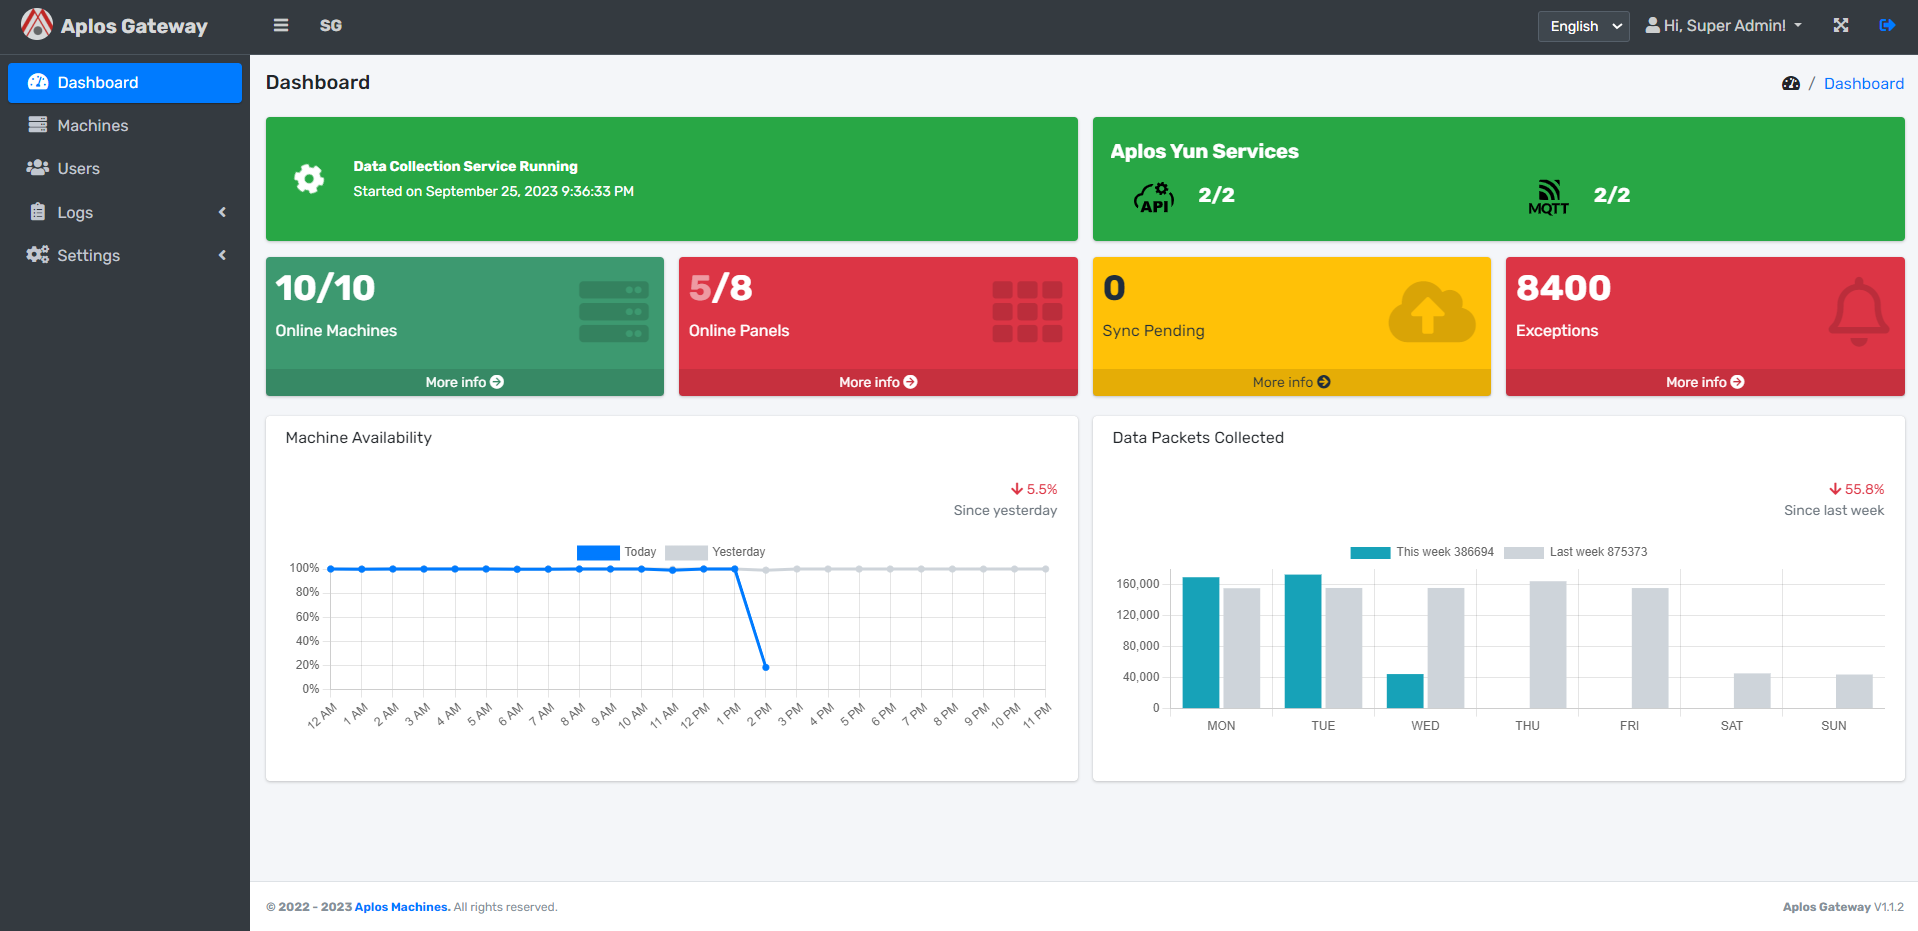
# Dashboard
Main Dashboard
The overview of the main page of Aplos Gateway.
# Data Collection Service
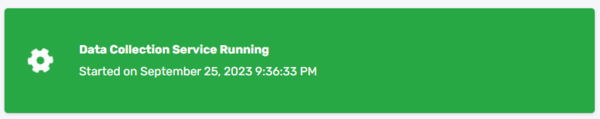
- Data Collection Service shows green background color means it is online.
- If you see silver background color, it is down.
- It also shows the time of the service started.
# Aplos Yun Service
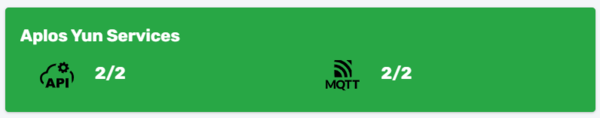
- Aplos Yun Service shows the number of connections to Aplos Yun and MQTT.
- If you see green background color means all the number of connections to Aplos Yun and MQQT are connected.
- If you see red background color means not all the number of connections to Aplos Yun and MQQT are connected.
# Online Machines

- Online Machines shows the number of machines are connected.
- Click on More Info will route to Machines.
# Online Panels

- Online Panels shows the number of operation panels are connected.
- If you see red background color means not all the number of operation panels are connected.
- If you see green background color means all the number of operation panels are connected.
- Click on More Info will route to Machines.
# Sync Pending
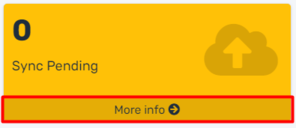
- Sync Pending shows the number of unsycned records to the Aplos Yun.
- If you see there are numbers there means the system is resyncing the data to Aplos Yun.
- Click on More Info will route to Machine Data.
# Exceptions
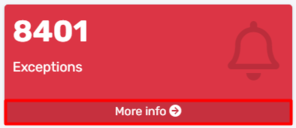
- Exceptions shows the number of exceptions in the last 7 days.
- Click on More Info will route to Event Log.
# Machine Availability
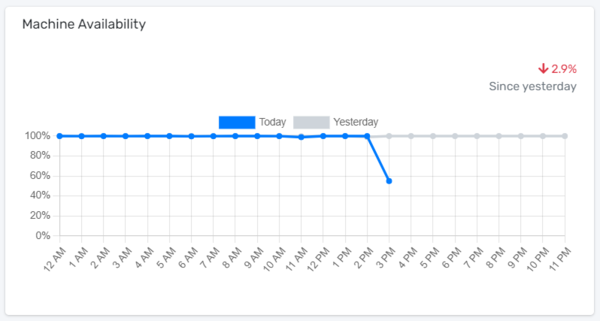
- Machine Availability shows the availability of the machines operated in the factory.
- It tracks the availability of the machines between Yesterday and Today hourly.
# Data Packet Collected
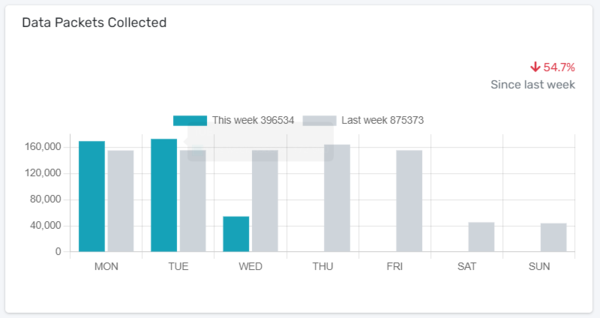
- Data Packet Collected shows the numbers of data collected from the machines.
- It tracks the data between Yesterday and Today in a day.